Decision Intelligence Document
The complete report package includes 5 reports, along with the accompanying research, analysis, and source artifacts.

This document has the key takeaways from the Emerging AI Trends 2026 collection. It is where the rubber meets the road and shows clearly why Prediction Oracle is different.
The decision intelligence document distills the AI trends, predictions, and black swan research and analysis into actionable insights for decision-makers.
This example is intended for CTOs who want to prepare for what lies ahead in 2026. But we very well could have given investors, small business owners, or other institutional decision-makers a customized version for their particular industry.
The best part of the Prediction Oracle Framework is that once the data points are collected, analyzed, and synthesized, it is adaptable across different domains and use cases.
To simplify the reading, I’ve summarized the main takeaway in a video slide presentation.
Decision Intelligence – AI Convergence Video
About this presentation:
This AI-generated presentation discusses the Prediction Oracle’s AI Decision Intelligence referenced in the focus study on Emerging AI Trends in 2026.
Decision Intelligence Document – Emerging AI Trends 2026
- Decision Name: Technology Stack and Infrastructure Positioning for Emerging AI Trends 2026 Convergence
- Decision Owner: Chief Technology Officer (CTO)
- Date Initiated: 2026-01-16
- Review Horizon: Q2 2026 (Critical convergence window: Apr-Jun 2026)
- Domain: Enterprise Technology Architecture & Infrastructure
- Core Question: How should a CTO position technology infrastructure, team capabilities, and vendor relationships for the convergence of three major AI trends (Agentic AI, Edge AI, Developer Infrastructure Shift) predicted to reshape enterprise technology by Q2 2026, given irreducible uncertainties around production deployment success, standardization outcomes, infrastructure readiness, and regulatory compliance?
Prediction Oracle Tools
Before we get started, here are a couple of tools designed to help with tough, complex decision-making.
- Tool 1 is a step-by-step guide: How to Use Decision Intelligence and Uncertainty to Decide What to Do
- Tool 2 is n easy to use checklist: Uncertainty-to-Decision Checklist
1. Separate the Reality Layers
1.1 Facts (True Right Now)
Technology Performance Data:
- Agentic AI: 88.5/100 composite score, 90% confidence, 10x ROI reported in pilots
- Edge AI: 84.3/100 composite score, 85% confidence, $21.4B market (2025), 28% CAGR
- Developer Infrastructure Shift: 83.2/100 composite score, 88% confidence, 84% developers using or planning to use AI tools
- TypeScript is #1 language on GitHub (AI-driven development preference)
- Stack Overflow questions declined 76% since ChatGPT launch (108,563/month to 25,566/month)
Infrastructure & Standards:
- Linux Foundation Agentic AI Foundation formed (OpenAI, Anthropic, Block), standardizing protocols (MCP, AGENTS.md)
- GitHub Octoverse 2025: 630M repositories, AI fuels developer surge
- 50% of tech jobs now require AI skills
Market & Vendor Data:
- IPO Pipeline: $3T combined valuation (OpenAI, Anthropic, SpaceX) preparing 2026 IPOs
- Strong correlation between trends: Agentic AI ↔ Developer Infrastructure (r = 0.85), Agentic AI ↔ Edge AI (r = 0.72)
Regulatory Status:
- 18+ state AI laws effective Jan 1, 2026
- Federal AI regulation framework expected Q2 2026 (details unknown)
Risk Data:
- 8 Black Swan scenarios identified with probabilities 20-45%
- Aggregate risk level: 35-40% (Medium-High)
- Highest probability risks: DeepSeek Validation Failure (45%), Production Deployment Failures (35%), Export Control (33%)
Prediction Data:
- Top 3 predictions: 98% probability each (Agentic AI Enterprise Adoption, Developer Infrastructure Shift, Edge AI Commercial Breakthrough)
- Target timelines: Q2 2026 for 30% Fortune 500 adoption, 90%+ developer adoption, 40% industrial PC market shift
1.2 Assumptions (Fragile)
⚠️ Treat these as fragile—any could break and change the technology strategy.
| Assumption | Confidence | What Would Invalidate It |
|---|---|---|
| Pilot success translates to production at scale | 75% | 5G deployment delays >6 months, edge computing gaps persist, supply chain disruptions, and infrastructure providers fail to deliver |
| Standardization (MCP, AGENTS.md) succeeds and achieves adoption | 85% | Competing standards emerge, vendor lock-in increases, industry coordination fails, <20% adoption after 6 months, vendor-specific protocols dominate |
| Production complexity causes failures, the skills gap widens, security concerns increase, the infrastructure is not ready, and vendor support is insufficient | 70% | Vendor bankruptcies, acquisitions disrupt support, pricing changes dramatically, vendor lock-in increases, and support quality degrades |
| Q2 2026 federal framework provides clarity rather than restrictions | 70% | Production complexity causes failures, the skills gap widens, security concerns increase, the infrastructure is not ready, and vendor support is insufficient |
| Market conditions remain favorable for IPO pipeline | 75% | Interest rate increases >0.5%, revenue shortfalls >30%, IPO stock price decline >20%, market correction >15%, vendor financial instability |
| DeepSeek Manifold Constrained method validates and provides cost advantages | 75.3% | Research replication fails, validation ongoing (very recent, Jan 2, 2026), export controls expand (33% probability), method proves impractical for production |
| Q2 2026 convergence window occurs as predicted | 75% | Timeline shifts to Q1/Q3, production deployment delays, infrastructure delays, regulatory delays, vendor roadmap changes |
| Production deployments scale within 6-12 months of pilots | 70% | Skills gap too large, training insufficient, talent market too competitive, internal resistance to change, and budget constraints |
| Team can acquire/build necessary AI capabilities | 80% | Vendor bankruptcies, acquisitions disrupt support, pricing changes dramatically, vendor lock-in increases, and support quality degrades |
| Vendor ecosystem remains stable | 75% | Vendor bankruptcies, acquisitions disrupt support, pricing changes dramatically, vendor lock-in increases, support quality degrades |
1.3 Unknowns (Irreducible)
Rule: Technology decisions must not depend on resolving these unknowns.
Timing Unknowns:
- Exact date of Q2 2026 convergence (could be Q1 or Q3)
- When production deployments will scale (6-12 month range, but exact timing unknown)
- When the federal regulatory framework is published (Q2 2026 expected, but could slip)
- When/if market bubble bursts (30% probability, but timing uncertain—Q2-Q4 2026 range)
- When competitors will respond with similar technology strategies
- When will vendor roadmaps deliver critical features
Scope Unknowns:
- Actual production deployment success rate (estimated from pilots, but production complexity unknown)
- True scalability of agentic AI systems beyond pilots
- Extent of infrastructure delays (30% probability, but magnitude unknown)
- Magnitude of regulatory restrictions if the framework is restrictive
- Actual market size if bubble bursts ($1T+ impact range, but exact magnitude unknown)
- True cost of compliance and security requirements
Adoption Unknowns:
- Whether enterprises will accept production agentic AI systems
- How quickly will standardization achieve critical mass (50%+ adoption threshold)
- Whether the infrastructure will be ready for the Edge AI breakthrough
- Market acceptance of the DeepSeek method if validated (export control risk: 33% probability)
- Consumer application emergence timeline (24-month horizon, but exact timing unknown)
- Whether internal teams will adopt new tools and workflows
Behavioral Unknowns:
- How enterprises will respond to production deployment failures (35% probability)
- How regulators will respond to security incidents or public backlash
- How will capital markets price the IPO pipeline if bubble concerns increase
- Whether developers will fully adopt AI tools or resist change
- How competitors will respond to early adopters’ advantages
- How internal teams will respond to technology changes
Policy/Regime Unknowns:
- Future federal AI policy changes (Q2 2026 framework details unknown)
- State-level policy coordination or fragmentation
- Changes to export control policies (33% probability of expansion)
- Grid operator or infrastructure policy shifts
- International regulatory coordination or fragmentation
- Compliance requirements for specific technology implementations
Technology Unknowns:
- Which vendor platforms will dominate (OpenAI, Anthropic, Google, others)
- Which standardization protocols will achieve critical mass
- How quickly will edge computing infrastructure mature
- Whether alternative architectures will emerge
- How security vulnerabilities will manifest in production
- How vendor ecosystems will consolidate or fragment
2. Weak Signals (Directional, Not Proof)
| Signal | Source | Direction | Why It Matters |
|---|---|---|---|
| Convergence Acceleration Pattern | Uncertainty Summary, Trender correlation analysis | Bullish | 18+ state laws effective Jan 1, 2026, but federal framework expected Q2 2026—4-6 month gap creates uncertainty. State-level fragmentation could create compliance complexity, or the federal framework could override state laws. The gap itself is a signal about regulatory coordination challenges affecting technology architecture decisions. |
| Production Deployment Divergence | Uncertainty Summary, Predictor assumptions | Ambiguous | 10x ROI reported in pilots, but 35% probability of major production failures. Pilot success doesn’t guarantee production success. Gap between pilot enthusiasm and production reality often precedes either breakthrough success or enterprise pullback. Critical for infrastructure planning. |
| Regulatory Framework Timing Gap | Uncertainty Summary, State laws + federal framework | Ambiguous | Multiple economists/analysts have warned about an AI bubble (30% probability), but investment flows remain strong, and the IPO pipeline continues. Divergence often precedes either bubble burst ($1T+ financial impact, 65% adoption slowdown) or sustained growth. Could affect vendor stability and pricing. |
| Market Bubble Warnings Persistence | Uncertainty Summary, Black Swan Assessment | Bearish | Linux Foundation coordination (positive signal), but 28% probability of standardization failure, creating fragmentation. Standardization success accelerates adoption, but fragmentation delays it. Outcome determines whether agentic AI achieves 30% Fortune 500 adoption by Q2 2026 and affects technology stack decisions. |
| Standardization Momentum vs. Fragmentation Risk | Uncertainty Summary, Linux Foundation + adoption metrics | Ambiguous | DeepSeek Manifold Constrained method announced, 75.3% probability of validation, but 45% probability of validation failure, 33% probability of export controls. If validated, provides a 30-50% reduction in training costs. If export controls expand, creates technology barriers. The uncertainty itself is a signal about geopolitical technology competition affecting vendor selection. |
| DeepSeek Validation Uncertainty | Uncertainty Summary, Recent announcement (Jan 2, 2026) | Ambiguous | Stack Overflow questions declined 76%, 84% developers using or planning to use AI tools, TypeScript #1 language—structural shift from human support to AI-assisted development. Proof point that developer infrastructure shift is real and accelerating. If it continues, 90%+ adoption by Q2 2026 is plausible, affecting team capability planning. |
| Infrastructure Dependency Risk | Uncertainty Summary, Edge AI market analysis | Bearish | Edge AI depends on 5G/edge computing infrastructure, but 30% probability of infrastructure delays (18-month delay risk). Edge AI commercial breakthrough predicted for Q2 2026, but infrastructure delays could disrupt timeline. This is a meta-signal about systemic infrastructure readiness affecting architecture decisions. |
| Developer Adoption Acceleration | Uncertainty Summary, Stack Overflow + GitHub data | Bullish | Stack Overflow questions declined 76%, 84% developers using or planning to use AI tools, TypeScript #1 language—structural shift from human support to AI-assisted development. Proof point that developer infrastructure shift is real and accelerating. If continues, 90%+ adoption by Q2 2026 is plausible, affecting team capability planning. |
3. Plausible Futures
Future 1: The “Convergence Success” (Optimistic)
What Changes: Trends converge in Q2 2026, production deployments succeed, standardization achieves critical mass, the regulatory framework provides clarity, and market conditions remain favorable.
What Breaks or Accelerates:
- Accelerates: Early adopters gain 3-5 year competitive advantage, 10x productivity multiplier, $800M-$1B market growth. Technology teams that position early gain a sustainable technical moat.
- Breaks: High concentration risk if thesis breaks, but convergence creates a sustainable moat. Technology teams that wait face vendor lock-in and higher costs.
Technology Implications:
- Standardization (MCP/AGENTS.md) enables vendor flexibility and interoperability
- Production deployments succeed, validating architecture decisions
- Infrastructure ready for Edge AI, enabling a distributed architecture
- Regulatory clarity enables compliant implementations
- Vendor ecosystem is stable, providing reliable support
Probability Indicators: Strong trend momentum, high prediction confidence (98%), positive standardization signals, favorable regulatory signals
Future 2: The “Production Failure Pullback” (Pessimistic)
What Changes: Production deployments fail (35% probability), enterprises pull back (45% deployment pullback), adoption delays 12-18 months, competitive advantage window closes.
What Breaks or Accelerates:
- Breaks: Significant opportunity cost, competitive disadvantage, $25B market impact. Technology teams face technical debt from failed implementations.
- Accelerates: If reversible, could be a buying opportunity for validated approaches. Technology teams that wait can learn from failures and adopt proven patterns.
Technology Implications:
- Production failures reveal architecture weaknesses
- Security breaches trigger increased compliance requirements
- Vendor support is insufficient for production complexity
- Skills gap becomes a critical bottleneck
- Infrastructure not ready for scale
Probability Indicators: Production deployment failures, security breaches, enterprise pullback signals, skills gap issues
Future 3: The “Market Bubble Burst” (Disruptive/Negative)
What Changes: AI investment bubble bursts in 2026 (30% probability), $1T+ financial impact, 65% adoption slowdown, IPO pipeline disrupted, and investment withdrawal.
What Breaks or Accelerates:
- Breaks: Severe—could break the investment thesis entirely, with a $1T+ financial impact. Technology teams face vendor instability, pricing changes, and support degradation.
- Accelerates: If reversible, could be a buying opportunity at lower valuations. Technology teams can acquire capabilities at a lower cost.
Technology Implications:
- Vendor bankruptcies disrupt the technology stack
- Pricing models change dramatically
- Support quality degrades
- Vendor consolidation reduces options
- Technology investments become stranded assets
Probability Indicators: Interest rate increases, revenue shortfalls, IPO failures, market correction signals, bubble warnings
Future 4: The “Regulatory Restriction” (Disruptive/Negative)
What Changes: Q2 2026 federal framework introduces severe restrictions (20% probability), or an AI ban occurs (20% probability), adoption is blocked, and the market size is reduced to $100B-$500B.
What Breaks or Accelerates:
- Breaks: Severe—could block adoption entirely, $250B+ market impact. Technology teams face complex compliance requirements and the need to redesign their architecture.
- Accelerates: If restrictions are targeted, compliant solutions could gain an advantage. Technology teams that prepare early gain a compliance advantage.
Technology Implications:
- Compliance requirements exceed current architecture capabilities
- Vendor solutions may not meet regulatory requirements
- Architecture redesign required for compliance
- Security requirements increase dramatically
- Vendor lock-in increases as compliant options reduce
Probability Indicators: Restrictive framework language, security incidents, public backlash, state-level bans expanding
Future 5: The “Standardization Fragmentation” (Delayed)
What Changes: Standardization efforts fail or fragment (28% probability), adoption delays 12-24 months, costs increase 30-60%, and interoperability issues emerge.
What Breaks or Accelerates:
- Breaks: Opportunity cost, but not capital loss—adoption delayed but not blocked. Technology teams face vendor lock-in and increased integration costs.
- Accelerates: Time to accumulate at a lower cost, wait for clarity on standardization. Technology teams can prepare for multiple protocol support.
Technology Implications:
- Multiple protocols require a multi-protocol architecture
- Vendor lock-in increases as standardization fails
- Integration costs increase 30-60%
- Interoperability issues create technical debt
- Architecture complexity increases
Probability Indicators: Standardization stalls, competing standards emerge, industry coordination fails, vendor lock-in increases
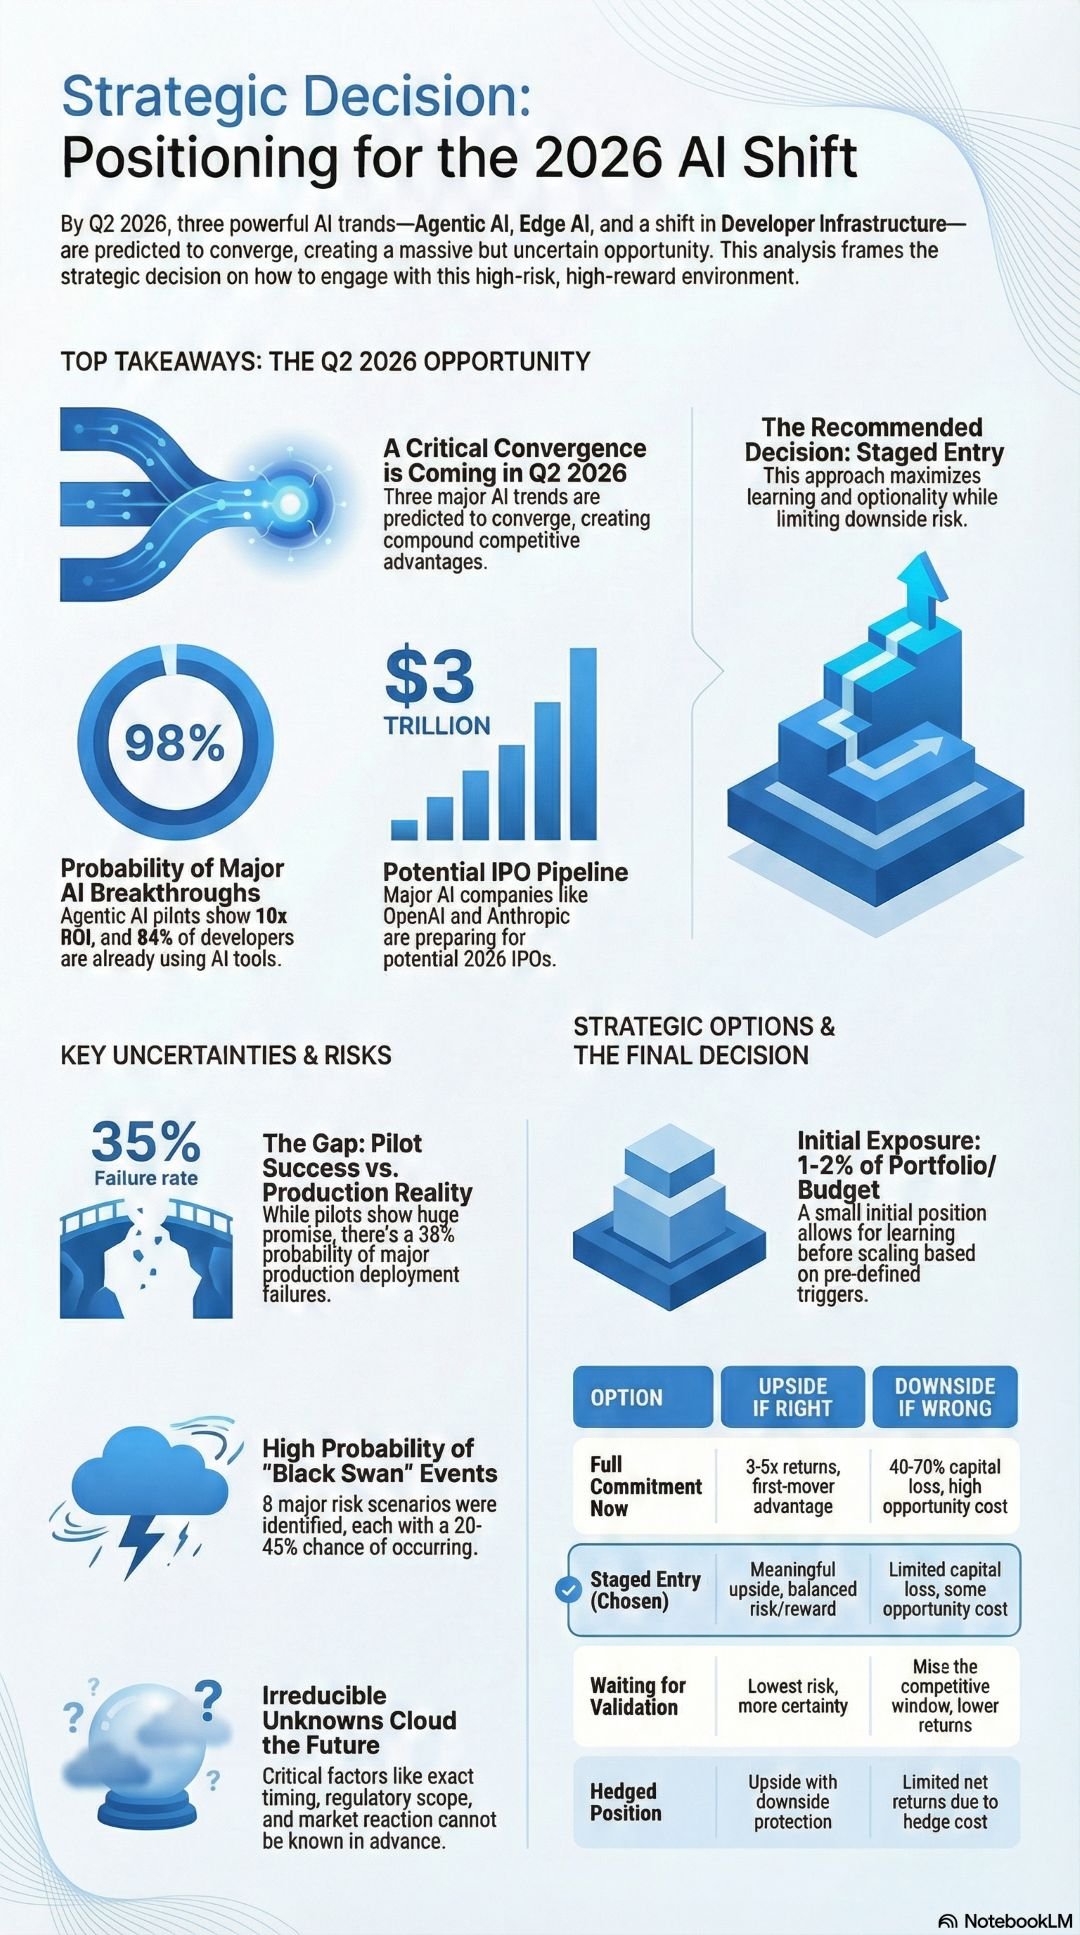
4. Decision Options (Regret-Based)
| Option | Upside if Right | Downside if Wrong | Reversibility | Optionality |
|---|---|---|---|---|
| Full Commitment Now | Capital loss of 40-70% if production failures, bubble burst, or regulatory restrictions occur. Opportunity cost if a better entry point emerges. Competitive disadvantage if timing is wrong. Technical debt from premature architecture decisions. | Meaningful participation in upside. Can scale up as signals confirm (Q2 2026 convergence validation). Balanced risk/reward profile. The technology team learns incrementally and reduces technical debt risk. | Partially reversible (can exit, but may be at a loss). High switching costs if infrastructure investments are made. Vendor lock-in increases. | Preserves optionality if thesis strengthens (can scale up). Destroys optionality if thesis breaks (forced to exit at loss, technical debt remains). |
| Staged Entry | Limited capital loss (smaller position). Still exposed to regulatory shock, bubble burst, and production failures. Opportunity cost if convergence accelerates faster than expected. | Highly reversible—can exit a small position easily. Can scale up or down based on signals. Lower vendor lock-in risk. | Participation in upside (though hedged). Protection against tail risks (bubble burst, regulatory restrictions, production failures). Balanced risk/reward with downside protection. The technology team maintains flexibility. | Preserves maximum optionality. Allows for learning and signal validation. Can adjust strategy as uncertainties resolve. Technology architecture remains flexible. |
| Waiting for Validation | Preserves capital for other opportunities. May miss the window if thesis accelerates. Lower risk, but lower reward. The technology team may face vendor lock-in as options are reduced. | Opportunity cost if convergence occurs on schedule and the competitive advantage window closes. May miss the best entry point (Q2 2026 convergence). Competitive disadvantage if early adopters gain a sustainable moat. The technology team lacks early expertise. | Fully reversible—no capital committed. Can enter when signals confirm. | Lower risk, but also lower returns (buying at a higher price after validation). More certainty, but less optionality. The technology team can learn from early adopters’ mistakes. |
| Hedged Position | Limited by hedge (diversification, risk mitigation strategies). The cost of hedging reduces net returns. Still exposed to tail risks (Black Swan scenarios). Architecture complexity increases. | Can unwind hedge if thesis strengthens. Can add to the position if the thesis weakens. Flexible risk management. | Limited by hedge (diversification, risk mitigation strategies). Hedging costs reduce net returns. Still exposed to tail risks (Black Swan scenarios). Architecture complexity increases. | Maximum optionality with risk management. Allows for learning while protected. Best of both worlds (upside participation + downside protection). Technology architecture supports multiple paths. |
5. Position Sizing
- Current Uncertainty Level: Medium-High (35-40% aggregate Black Swan risk, multiple irreducible unknowns, timing/scope/adoption/behavioral/policy/technology uncertainties)
- Recommended Initial Technology Investment: 1-2% of technology budget (or equivalent resource allocation)
- Rationale:
- High prediction confidence (98% for top 3 trends) but significant Black Swan risk (8 scenarios, 20-45% probability each)
- Strong directional signals (convergence pattern, developer adoption acceleration) but fragile assumptions (pilot→production, standardization, regulatory clarity, infrastructure readiness)
- Q2 2026 convergence window creates time pressure, but uncertainties cannot be resolved today
- Small investment maintains optionality and learning exposure while limiting downside if thesis breaks
- Allows for staged scaling as uncertainties resolve (production validation, regulatory clarity, standardization adoption, infrastructure readiness)
- Technology teams can build capabilities incrementally without over-committing to unproven architectures
- Preserves budget for other technology priorities while maintaining AI positioning
Technology Investment Breakdown:
- Infrastructure: 30-40% (edge computing, 5G readiness, cloud infrastructure)
- Vendor Relationships: 20-30% (pilot programs, early access, training)
- Team Capabilities: 20-30% (training, hiring, skill development)
- Compliance & Security: 10-20% (regulatory preparation, security frameworks)
- Research & Development: 10-15% (internal experimentation, proofs-of-concept)
6. Pre-Committed Triggers
6.1 Scale-Up Triggers
Observable Conditions That Justify Increasing Technology Investment:
- Q2 2026 Convergence Occurs: 30% Fortune 500 adoption (Agentic AI), 40% industrial PC market shift (Edge AI), 90%+ developer adoption (Developer Infrastructure) achieved on or before schedule
- Production Deployments Succeed: 3+ Fortune 500 companies deploy successfully, <20% failure rate, no major security breaches, architecture patterns validated
- Regulatory Framework Provides Clarity: Q2 2026 framework published, language is supportive (not restrictive), state-federal coordination succeeds, compliance requirements are clear
- Standardization Achieves Critical Mass: MCP/AGENTS.md adoption reaches 50%+ threshold, vendor support increases, no competing standards emerge, interoperability proven
- Infrastructure Readiness Improves: 5G deployment on schedule, edge computing gaps resolved, supply chain disruptions minimal, and infrastructure providers deliver
- DeepSeek Method Validates: Research replication succeeds, no export controls expand, validation confirmed by Q2 2026, cost advantages materialize
- Vendor Ecosystem Stabilizes: Major vendors demonstrate financial stability, support quality improves, pricing models stabilize, and vendor roadmap clarity increases
Scaling Protocol: If 3+ bullish triggers occur within 30 days, increase technology investment by 50-100% (from 1-2% to 2-4% of technology budget)
6.2 Scale-Down / Exit Triggers
Observable Conditions That Justify Reducing or Exiting Technology Investment:
- Production Failures Occur: 3+ major failures, >30% failure rate, cascading failures in orchestrated agent systems, security breaches in production
- Regulatory Restrictions Introduced: Q2 2026 framework introduces severe restrictions or an AI ban, state-level bans expand to 10+ states, and compliance requirements exceed capabilities
- Market Bubble Bursts: 6+ bubble indicators trigger (interest rate increases >0.5%, revenue shortfalls >30%, IPO stock price decline >20%, market correction >15%), $1T+ financial impact, vendor instability
- Standardization Fragments: Competing standards emerge, <20% adoption after 6 months, industry coordination fails, vendor lock-in increases
- Infrastructure Delays Persist: 5G delays >6 months, edge computing gaps persist, supply chain disruptions continue, and infrastructure providers fail
- DeepSeek Export Controls Expand: 3+ state bans, federal restrictions announced, geopolitical tensions escalate, technology barriers increase
- Vendor Ecosystem Destabilizes: Major vendor bankruptcies, acquisitions disrupt support, pricing changes dramatically, and support quality degrades significantly
Exit Protocol: If 2+ bearish triggers occur within 30 days, reduce technology investment by 50%+. If 4+ bearish triggers occur, exit position immediately and reassess architecture.
7. Kill Switch
Conditions That Immediately Invalidate the Decision and Require Exit or Stop:
- Regulatory AI Ban: The federal government announces an AI ban or severe restrictions that block adoption entirely, making technology investment impossible
- Market Bubble Burst with >$1.5T Impact: Bubble bursts with financial impact exceeding $1.5T, causing systemic market collapse, vendor ecosystem collapse
- Production Failures Affect 5+ Fortune 500 Companies: Cascading failures affect 5+ major enterprises simultaneously, triggering industry-wide pullback, architecture patterns invalidated
- Standardization Fragmentation with <10% Adoption: Competing standards emerge, and adoption falls below 10%, indicating complete fragmentation, vendor lock-in, and extreme
- Infrastructure Delays Exceed 12 Months: 5G/edge computing delays exceed 12 months, indicating systemic infrastructure failure, Edge AI timeline invalidated
- Critical Vendor Bankruptcy: Major technology vendor (OpenAI, Anthropic, Google) declares bankruptcy or is acquired in a distressed sale, disrupting the technology stack
- Security Breach Cascade: Multiple major security breaches in agentic AI systems within 30 days, triggering regulatory bans, invalidating architecture assumptions
Kill Switch Protocol: If any kill switch condition is met, exit technology investment immediately (within 24 hours), regardless of current investment level or entry point. Reassess architecture and vendor relationships. Preserve learning and relationships for potential re-entry when conditions stabilize.
8. Learning Objectives
What the CTO and technology organization are trying to learn by acting early:
- Production Deployment Reality: Whether pilot success translates to production at scale, actual failure rates, enterprise acceptance patterns, and architecture requirements for production
- Standardization Adoption Dynamics: How quickly MCP/AGENTS.md achieves critical mass, whether fragmentation occurs, vendor support patterns, and interoperability requirements
- Regulatory Framework Impact: Whether the Q2 2026 framework provides clarity or restrictions, state-federal coordination, compliance complexity, and security requirements
- Market Bubble Risk Validation: Whether bubble warnings materialize, actual market correction magnitude, IPO pipeline resilience, vendor financial stability
- Convergence Window Timing: Whether Q2 2026 convergence occurs as predicted, actual timing and magnitude of trend convergence, and technology readiness requirements
- Infrastructure Readiness: Whether 5G/edge computing infrastructure is ready, actual deployment timelines, supply chain resilience, and infrastructure provider reliability
- DeepSeek Method Validation: Whether the method validates, export control risk materializes, adoption patterns if validated, cost advantage magnitude
- Competitive Dynamics: How early adopters gain advantages, competitor response patterns, market share shifts, and technology differentiation opportunities
- Vendor Ecosystem Stability: Which vendors survive market consolidation, pricing model evolution, support quality trends, and vendor lock-in risks
- Team Capability Requirements: Actual skills needed for production deployment, training effectiveness, hiring market dynamics, internal resistance patterns
- Architecture Patterns: Which architecture patterns succeed in production, scalability requirements, security patterns, and integration complexity
- Technology Stack Decisions: Which technology stacks provide the best ROI, vendor selection criteria, multi-vendor vs single-vendor strategies, and technical debt accumulation
Learning is considered a valid return at this stage—even if financial returns are limited, understanding these dynamics provides strategic technology intelligence for future positioning and architecture decisions.
9. Review Cadence
Scheduled Review Dates
- Q2 2026 (Apr-Jun 2026): Critical convergence window deadline—mandatory comprehensive technology review
- Q2 2026 (Apr-Jun 2026): Regulatory framework publication—validate or adjust technology compliance strategy
- Q3 2026 (Jul-Sep 2026): Production deployment validation—assess success/failure rates, architecture patterns
- Q4 2026 (Oct-Dec 2026): Full-year execution validation—comprehensive technology review
Event-Driven Review Triggers
- Any Production Deployment Failure: 3+ major failures → immediate technology architecture re-evaluation
- Any Regulatory Announcement: Federal framework, state bans, export controls → immediate compliance strategy re-evaluation
- Any Market Bubble Indicators: 6+ indicators trigger → immediate vendor stability assessment
- Any Standardization Fragmentation: Competing standards, <20% adoption → immediate architecture re-evaluation
- Any Infrastructure Delay: 5G delays >6 months, edge computing gaps → immediate infrastructure strategy re-evaluation
- Any DeepSeek Validation Result: Success or failure → immediate vendor selection re-evaluation
- Any Vendor Instability: Bankruptcy, acquisition, pricing changes → immediate vendor relationship re-evaluation
- Any Security Breach: Major security incident in agentic AI systems → immediate security architecture re-evaluation
Signal-Driven Review Triggers
- If 3+ Bearish Triggers Occur Within 30 Days: → immediate technology strategy re-evaluation
- If 3+ Bullish Triggers Occur Within 30 Days: → consider scaling up technology investment
- If Key Assumption Invalidated: → immediate technology architecture re-evaluation
- If Q2 2026 Convergence Window Closes Without Convergence: → re-evaluate technology thesis
- If Team Capability Gap Widens: → immediate skill development strategy re-evaluation
- If Vendor Lock-In Risk Increases: → immediate vendor diversification strategy re-evaluation
10. Final Decision Statement
Given current uncertainty and directional signals, we choose staged entry with 1-2% initial technology investment, designed to maximize optionality and learning while limiting downside. We will scale or exit only via predefined triggers.
Rationale:
- High prediction confidence (98% for top 3 trends) but significant Black Swan risk (35-40% aggregate)
- Strong directional signals (convergence pattern, developer adoption) but fragile assumptions (pilot→production, standardization, regulatory clarity, infrastructure readiness)
- Q2 2026 convergence window creates time pressure, but uncertainties cannot be resolved today
- Staged entry preserves maximum optionality while allowing for learning and signal validation
- Pre-committed triggers enable disciplined scaling or exit based on observable events, not opinions
- Technology teams can build capabilities incrementally without over-committing to unproven architectures
Technology Investment Management:
- Initial Investment: 1-2% of technology budget (establishes learning exposure, maintains optionality)
- Scale-Up Conditions: 3+ bullish triggers within 30 days → increase to 2-4% of technology budget
- Scale-Down Conditions: 2+ bearish triggers within 30 days → reduce by 50%+
- Exit Conditions: 4+ bearish triggers or any kill switch condition → exit immediately
- Capital Reserve: Maintain 5-10% of technology budget for staged commitments as signals evolve
Technology Architecture Principles:
- Vendor Diversification: Avoid single-vendor lock-in, maintain multi-vendor options
- Protocol Flexibility: Support multiple standardization protocols until a clear winner emerges
- Infrastructure Readiness: Assess infrastructure before full Edge AI commitment
- Compliance Preparation: Build compliance infrastructure early, prepare for regulatory outcomes
- Security First: Prioritize security architecture, prepare for production deployment requirements
- Team Capability Development: Invest in training and skill development incrementally
- Technical Debt Management: Avoid premature architecture decisions that create technical debt
Monitoring Commitment:
- Daily monitoring for critical scenarios (Bubble Burst, Export Control, Production Failures, Vendor Instability)
- Weekly monitoring for medium-priority scenarios (Standardization, Infrastructure, DeepSeek, Team Capabilities)
- Monthly comprehensive review of all signals, assumptions, and unknowns
- Quarterly mandatory review at Q2, Q3, Q4 2026 checkpoints
- Continuous vendor relationship management and stability assessment
Technology Team Responsibilities:
- Architecture Team: Monitor standardization adoption, evaluate architecture patterns, assess infrastructure readiness
- Security Team: Monitor security incidents, assess compliance requirements, evaluate security architecture
- Infrastructure Team: Monitor 5G/edge computing deployment, assess infrastructure readiness, evaluate provider reliability
- Vendor Management: Monitor vendor stability, assess pricing changes, evaluate support quality
- Development Team: Monitor developer adoption trends, assess tool effectiveness, evaluate productivity gains
- Compliance Team: Monitor regulatory developments, assess compliance requirements, evaluate framework impact
Infographic
Decision Intelligence Document Generated: 2026-01-16
Next Review: Q2 2026 Convergence Window (Apr-Jun 2026) or upon production deployment milestone
Status: Active – Awaiting CTO decision and initial technology investment allocation
Sources:
This audio was generated with NotebookLM on 01-10-2026 using the Prediction Oracle Trend Report referenced in the Sample Report: Emerging AI Trends 2026 Strategic Options
- Decision Intelligence Document:
decision-intelligence-emerging-ai-trends-2026-2026-01-16-v2.md– Watch the Decision Intelligence Deep Dive: Decision Intelligence Sample – Emerging AI Trends 2026 - Trender Report:
Emerging-AI-Trends-2026-trender-report-2026-01-04-v1.md(6 trends, 82% confidence). Listen to an audio Deep Dive: Sample Report – Emerging AI Trends for 2026 (audio version) - Predictions Report:
emerging-ai-trends-2026-predictions-report-2026-01-04-v1.md(7 predictions, 87% confidence) Listen to an audio Deep Dive: Sample Report – Emerging AI Predictions for 2026 (audio version) - Black Swan Assessment:
emerging-ai-trends-2026-black-swan-assessment-2026-01-04-v1.md(8 scenarios, 78% confidence) Listen to the deep dive: Sample Report – Emerging AI Trends 2026 Black Swan Assessment (audio version) - Uncertainty Summary: uncertainty-summary
-ai-trends-2026-black-2026-01-16-v1.md(8 scenarios, 78% confidence) Listen to the deep dive: Uncertainty Summary Sample – Emerging AI Trends 2026 (audio version)
If you’d like to see more sample reports like this, visit the Prediction Oracle archive.
To improve our output, we welcome your professional, objective feedback and comments.